| |
|
5.1. DATABASE SERVICES
|

|
- EXPLORE THE ANNOTATIONS
- SEARCH THE BINDING SITES OF A TF
- SEARCH THE PROMOTERS OF A TF
- CONSTRUCTION OF BENCHMARKS
- EVALUATION OF PREDICTIONS
|
5.2. ANNOTATION PROCEDURE
|
|
The annotation and correction of orthologous binding sites is complex and difficult. Most of the
process requires manual intervention so that it is slow. The next procedure has been followed
in order to build the current compilation of ABS binding sites:
- Search papers in which a set of binding sites have been experimentally verified in a promoter.
- Retrieve the promoter sequence that appears in the paper using its GenBank accession number.
- Search other works in which an orthologous promoter is annotated, if available.
- Compare the promoter sequences with the corresponding REFSEQ annotation
- Search the promoters at the database dbTSS to evaluate the correctness of the TSS annotation
- Map each site in the corresponding promoter sequence performing the alignment between both (BLASTN, CLUSTALW, exact matching).
- The functional sites on each promoter are considered to be orthologous when the relationship is
already published or there is enough evidence in the alignments (sequence and position)
The annotation of the TSS of a gene is a very delicate process prone to errors. All of the promoters in the
ABS database have been first mapped in the corresponding genome, and then a posterior check with the more
accurate dbTSS is performed.
The following table contains the shift between the REFSEQ and the dbTSS annotations of the TSS. Positive
number N means the dbTSS annotation is N nucleotides on the right of the REFSEQ, negative
value means the contrary direction. N/A means annotation not available in dbTSS.
Follow this link to explore the differences between REFSEQ and dbTSS annotations
|
5.3. PREDICTIONS
|
|
Complementarily to the annotations, we have performed a computational prediction of the putative binding
sites on each promoter sequence using the collections of position weight matrices JASPAR, PROMO and TRANSFAC.
This is an example of such matrices:
TBP
1    61   145   152    31
2    16    46    18   309
3   352     0     2    35
4     3    10     2   374
5   354     0     5    30
6   268     0     0   121
7   360     3    10     6
8   222     2    44   121
9   155    44   157    33
10   56   135   150    48
11   83   147   128    31
12   82   127   128    52
13   82   118   128    61
14   68   107   139    75
15   77   101   140    71
|
Each row in the matrix corresponds to the observed distribution of nucleotides
in this position of the motif after an aligment of real sites was done. Thus,
the element M(x,i) in the matrix is the number of cases in which the nucleotide
x was observed at position i. The probability or score to observe such fact
is obtained with P(x,i) = M(x,i) / M(A,i) + M(C,i) + M(G,i) + M(T,i). The maximum
score MAX_SCORE of a matrix is the sum of the highest score at each row. The
minimum score MIN_SCORE of a matrix is the sum of the lowest score at each row.
The scoring method for a segment S=s1s2...sn with a matrix
P is:
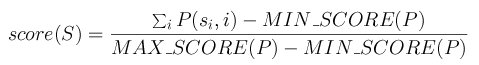
Two different thresholds have beem employed to accept the predicted sites above such a value:
a restrictive 0.85 and a more flexible 0.70.
Each line in the output of these predictions possess this display:
U04320 MatScan TBP 474 488 0.76 + . # ATATAAGGGGCAGGC
|
where the description of each field is:
- Column 1: Sequence name
- Column 2: Name of our simple computational program
- Column 3: Name of the transcription factor
- Column 4: First position of the putative binding site
- Column 5: Second position of the putative binding site
- Column 6: Score (between 0 and 1)
- Column 7: Strand (+ or -)
- Column 8: Empty. Required by the GFF format
- Column 9: The sequence of the binding site
|
5.4. ALIGNMENTS
|
|
Phylogenetic footprinting methods are based on the alignment of related promoters to then analyze
the unusually conserved blocks with other methods. In this release, we provide a pairwise local
alignment and a multiple global alignment for each entry with the widely known programs BLASTN
and CLUSTALW (default parameters). AVID and LAGAN alignments are also provided.
For instance, a putative TATA box is clearly identified in this global alignment:
Y00474                     -CCCTATAAAACCCAGCG-GCGCGACGCGCCACC- 501
rn3_refGene_NM_031144      -TCCTATAAAACCCGGCG-GCGCAACGCGCAGCCA 498
X00182                     GCCCTATAAAAAGCGAAGCGCGCGGCGGGCG---- 501
                             *********  *   * ****  ** **
|
Depending on the evolutionary distance, such an alignment can be useless because most of the promoter
regions are conserved so that additional promoters of the orthologs in other species are necessary to highlight
the conserved blocks.
CopyRight © 2005
ABS is under GNU General Public License.
|
|