Regulation of Human obese protein gene
Practical exercise
Enrique Blanco - eblanco@imim.es
Abstract: In this exercise, the previously annotated promoter region of the Leptin gene (obese protein gene) will be used to test different methods for predicting regulatory elements. First of all, a matrix will be constructed from a real collection of sites. Secondly, the TRANSFAC database will be accessed to extract real matrices and then, the promoter sequence will be scanned searching for promoter motifs. Finally, due to the number of false positives that will be obtained, a phylogenetic approach will be suggested. Both human and mouse homologues will be aligned to elucidate the coordinates of the actual binding sites.
Colour legend:
Genomic element Operations or links
A. Description of the gene
Step 1. Retrieve the annotation and the sequence of the gene (EMBL database)
- Go to EMBL database at EBI
- mRNA sequence: Type U43653 in Nucleotide sequences
- On top, click over the EMBL:HS436531 entry
- Have a look at the description: IDs, references, attributes, sequences
- Search the Feature of Coding Sequence (FT CDS). Click over and check the ORF correctness: the beginning and the end of the sequence correspond respectively to the Start and Stop codons?
Step 2. Learn more about the Leptin gene
Using a genome browser
- Go back to the initial screen that contained the result of your first query.
- On the left, you will find the Display Options box.
- Select the FastaSeqs view and press the button Apply Display Options
- Open the UCSC genome browser
- Select the alignment program Blat (human genome)
- Paste the Fasta sequence of the Leptin gene and submit the query
- Browse the first hit in the list of matches
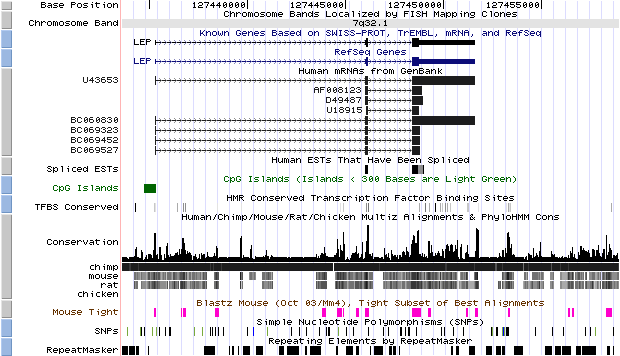
- Have a look at the different displaying options. We recommend to zoom out 10x the initial picture to explore the genomic landscape around the gene. For instance, try to:
- obtain the RefSeq gene sequence
- check the presence of a CpG island in the promoter
- examine the mRNAs supporting the gene annotation
- evaluate the conservation between orthologues
- Task1: What do you have to do if you want to see the computationally predicted transcription factor binding sites?
- Task2: Try to locate the sequence in other genomes using BLAT (e.g. mouse)
Using the LocusLink database
- Go to LocusLink database at NCBI
- Type U43653 in Query
- Click on the entry LEP (leptin)
- Identify main fields in the entry: functional description, NM and NP annotations
Step 3. PROMOTER information: sequence and experimental annotation
- Go to EMBL database at EBI and type U43589 in Nucleotide sequences
- Promoter sequence:
promoter (FASTA sequence, 1000 bps upstream the TSS) [Entry: U43589]
- Publication:
Mason MM, He Y, Chen H, Quon MJ, Reitman M. Regulation of leptin promoter function by Sp1, C/EBP, and a novel factor.Endocrinology. 1998 Mar;139(3):1013-22.
- Promoter annotation in GFF format (see more about GFF format here)
Figure 1. Graphical representation of the three regulatory elements annotated in the promoter U43589 (500 bps upstream the TSS)
B. Building representations of binding sites
Step 4. Accessing Transfac database
Note: TRANSFAC is free for users from non-profit organizations but requires a registration
- Go to TRANSFAC database
- In TRANSFAC 6.0: choose Search action
- Select the table of Factor
- Enter the factor name TBP (tata binding protein)
- Set Factor Name (FA) as searching field and submit the query
- Select (T00794): you will find a description of the factor in human
- (On the left) Find these fields: (BS) for binding sites, (MX) for matrices
- Select one of the sites for inspection
Step 5. Building a model from a set of actual sites
- This is a collection of real TBP sites extracted from TRANSFAC. Observe the different characteristics and the conservation of the core
- Open the CLUSTALW webserver at EBI
- Paste the collection of 23 TBP sites
- Switch on the boxes:
- ALIGNMENT = fast
- COLOR ALIGNMENT = yes
- OUTPUT FORMAT = aln wo/numbers
- Press the Run button
- Open the WebLogo webserver
- Paste the CLUSTAL alignment into the corresponding box
- Activate DNA/RNA in the Sequence type box
- Submit the query (Create logo) to obtain a representation for the collection of TBP sites as the following. Notice the highligthed core of the binding site (TATAAAA)
Figure 2. Graphical representation of the alignment of 23 real TATA binding sites
Step 6. Obtaining the TRANSFAC position weight matrices
Alternative solution: PROMO is a database of pre-computed matrices that allows you to select the species or group of species from which a new weight matrix will be constructed for a given factor, using TRANSFAC binding sites.
- Go to TRANSFAC database
- In TRANSFAC 6.0: choose Search action
- Select the table of Matrix
- Enter the factor name TATA
- Set Factor Name (FA) as searching field and submit the query
- There are two entries: M00252 and M00216
- Select M00252 matrix
- Repeat the procedure to recover the SP1 (M00008) and c/EBP (M00159) matrices
- Conserve the windows containing the three matrices
C. Computational prediction of regulatory elements (binding sites)
Step 7. Searching for the annotated regulatory elements with current matrices
- Open RSA tools webserver
- On the left frame, click on Pattern matching - patser (matrices)
- Paste the Human obese protein gene promoter (1000 bps)
- Select transfac as Matrix Format and paste the Transfac TATA matrix (including matrix header)
- Set Origin to start (of the sequence) and press GO
- Check the results: one of these two putative TATA sites is the real one (use the annotations)
- To obtain a graphical representation of predictions, press feature map
- Set as Display limits from 0 to 1000 and press GO
- Repeat the procedure using the SP1 and cEBP matrices, trying to find the real sites into the predictions. Notice the amount of false positives predicted only using one matrix
Step 8. Ab initio promoter prediction
- Go to TRANSFAC applications
- Choose the program Match to scan promoter sequences searching for sites using the complete library of TRANSFAC matrices
- Paste the Human obese protein gene promoter in the text area
- Set cut-offs: 0.75 (matrix similarity) and 0.85 (core similarity)
- Submit the query
- Find the real annotations (e.g. TBP and CEBP) in this text output. Notice the huge number of false positive predictions
Figure 3. Graphical representation of predicted binding sites using MATCH + TRANSFAC in the promoter sequence U43589 (all of the predictions are not shown)
D. Comparative promoter prediction (human/mouse)
Step 9. Human-Mouse comparisons
- We have obtained the homologous gene promoter (FASTA, 1000 bps upstream the TSS) in mouse [Entry: U36238]
- Now, these are the annotations (promoter elements) in both sequences (human and mouse)
- This is a graphical comparison of both promoter annotations. Observe the phylogenetic footprinting or conservation in the regulatory elements
Figure 4. Graphical comparison of the annotations in the human promoter U43589 and its homologue in mouse (500 bps upstream the TSS)
Step 10. Locating short conserved regulatory elements
- Connect to Blast 2 Sequences web server
- Paste both sequences [human promoter and mouse promoter] in the corresponding text boxes
- To detect short conserved stretches of DNA, set the following parameters:
- Mismatch = -5
- Gap extension = 0
- Notice that some short very well conserved HSPs (blast fragments) at the end of the sequence. Check the annotations to verify whether they correspond to real binding sites or not
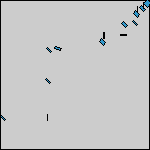
Figure 5. Graphical comparison of blastn alignment of human promoter U43589 and its homologue U36238 in mouse
- Now, ab initio promoter prediction serches can be performed again but only on those interesting regions, using RSA tools or TRANSFAC
- When more than 2 genomes are available, a multiple local alignment can be performed with programs such as MEME or Alignace
E. Results
Here you can find the solutions to every exercise:
F. Bibliography
- J.F. Abril and R. Guigó. gff2ps: visualizing genomic annotations. Bioinformatics 16:743-744 (2000).
- Matys V, Fricke E, Geffers R, Gossling E, Haubrock M, Hehl R, Hornischer K, Karas D, Kel AE, Kel-Margoulis OV, Kloos DU, Land S, Lewicki-Potapov B, Michael H, Munch R, Reuter I, Rotert S, Saxel H, Scheer M, Thiele S, Wingender E. TRANSFAC: transcriptional regulation, from patterns to profiles. Nucleic Acids Research 31:374-378 (2003).
- van Helden J. Regulatory sequence analysis tools.Nucleic Acids Res. 31:3593-3596 (2003).
- JD Thompson, DG Higgins, and TJ Gibson. ClustalW: improving the sensitivity of progressive multiple sequence alignment through sequence weighting, position-specific gap penalties and weight matrix choice. Nucl. Acid Res. 22:4673-4680 (1994).
- Altschul, S.F., Gish, W., Miller, W., Myers, E.W. & Lipman, D.J. Basic local alignment search tool. J. Mol. Biol. 215:403-410 (1990).
- Timothy L. Bailey and Charles Elkan. Fitting a mixture model by expectation maximization to discover motifs in biopolymers. Proceedings of the Second International Conference on Intelligent Systems for Molecular Biology, pp. 28-36, AAAI Press, Menlo Park, California (1994).
- Roth, FR, Hughes, JD, Estep, PE & GM Church. Finding DNA Regulatory Motifs within Unaligned Non-Coding Sequences Clustered by Whole-Genome mRNA Quantitation. Nature Biotechnology 16:939-945 (1998).
- X. Messeguer, R. Escudero, D. Farré, O. Núñez, J. Martínez and M.Mar Albà. PROMO: detection of known transcription regulatory elements using species-tailored searches. Bioinformatics Vol. 18: 333-334 (2002).
- Mason MM, He Y, Chen H, Quon MJ, Reitman M. Regulation of leptin promoter function by Sp1, C/EBP, and a novel factor. Endocrinology. 139:1013-1022 (1998).